
Best Greyhound Betting Sites – Bet on Greyhounds in 2026
Greyhound racing punters love to argue about trap bias. Walk into any betting shop on a Tuesday afternoon and you will hear someone insist that trap one at Sheffield is a licence to print money, while another swears by the stripes in box six. The truth sits somewhere between superstition and statistics, and Sheffield dogs trap statistics offer a genuinely useful edge for anyone willing to look at the numbers properly.
Sheffield Owlerton is not just any track. Its 425-metre circumference and 60.5 to 62-metre run to the first bend create specific conditions that favour certain starting positions over others. These are not random variations but measurable patterns that repeat across thousands of races. Understanding them will not turn you into a guaranteed winner, but it will stop you making the same mistakes that cost casual punters money week after week.
This guide breaks down trap performance at Owlerton with the kind of detail you will not find in a tipster’s one-liner. We will examine win rates, place percentages, and how trap bias shifts across different distances. By the end, you will know when to trust the numbers, when to override them with form, and when to recognise that the trap draw is the single most important factor in a race.
How Trap Draw Works in Greyhound Racing
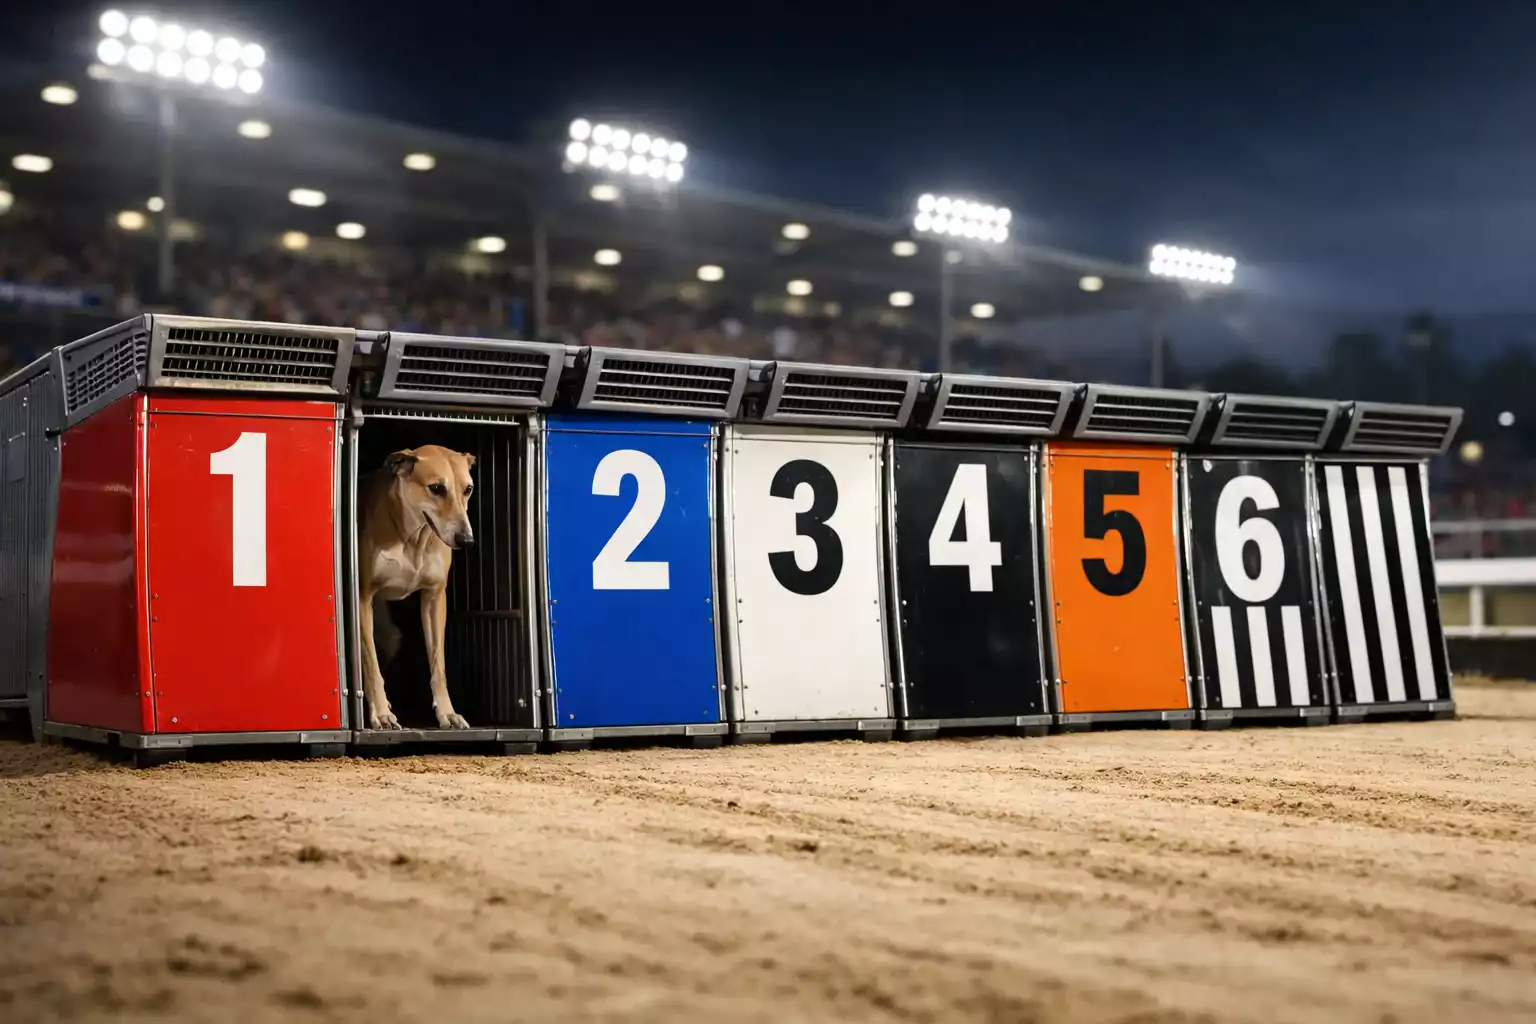
Every greyhound race in the United Kingdom uses six starting boxes arranged in a line across the track. The traps are numbered one through six from the inside rail outward, each wearing a distinctive colour that makes identification easier for spectators and punters alike. Trap one wears red, trap two blue, trap three white, trap four black, trap five orange, and trap six carries black and white stripes. These colours remain constant across every licensed track in Britain, so a punter familiar with Sheffield will recognise the same system at Romford or Monmore.
The trap assignment process involves more than drawing numbers from a hat. Racing managers use a combination of recent form, running style, and previous trap performance to decide where each dog starts. A greyhound known for hugging the inside rail will often find itself in traps one or two, while a wide runner might be placed in five or six. The system aims to create competitive racing by giving each dog a theoretically fair chance, but the geometry of individual tracks means certain positions carry inherent advantages.
Sheffield’s racing office assigns traps based on grading criteria that balance fairness with the realities of track shape. Dogs move between grades depending on their recent results, and each grade carries its own trap allocation logic. The process sounds scientific, and it partly is, but the fundamental truth remains unchanged: some traps at Sheffield win more often than probability would suggest, and some win less.
Understanding the mechanics matters because it reveals why trap bias exists in the first place. When six dogs break from boxes spanning roughly ten metres of track width and all aim to negotiate the same first bend, physics takes over. The inside dog has a shorter distance to travel. The outside dog must cover more ground. The middle traps face traffic from both sides. These basic facts create the statistical patterns that clever punters exploit.
Sheffield’s Trap Bias: The Numbers
Raw win percentages at Sheffield tell a clear story. Across all distances and race types, trap one at Owlerton historically produces a win rate above the theoretical 16.67% that perfect fairness would suggest. Trap three typically sits close to or slightly above average, while traps five and six consistently underperform. The precise figures fluctuate with sample size and time period, but the directional trend remains stable year after year.
The inside advantage at Sheffield stems directly from track geometry. With a circumference of 425 metres and a run to the first bend of between 60.5 and 62 metres depending on the starting position, dogs breaking from trap one reach the corner first if they show anything like average early pace. That early positioning advantage compounds through the race because greyhounds running behind must find space to pass, often losing ground in the process.
Place percentages paint a more nuanced picture. While trap one wins most often, its place rate shows less dominance because dogs that fail to lead into the first bend from the inside often finish worse than their counterparts from middle traps. Trap three, for example, produces a place percentage that sometimes exceeds its win rate advantage, suggesting it offers a safer option for each-way betting even if it captures fewer outright victories.
Comparing Sheffield to the national average reveals both similarities and differences. Most British tracks show some inside bias because most tracks share similar first-bend dynamics. Sheffield’s bias is neither the strongest nor the weakest in the country, but it is pronounced enough to matter. A dog that would be an even-money chance on pure form might drift to 6/4 from trap six, and that price adjustment reflects genuine probability rather than bookmaker manipulation.
The data available for analysis has improved substantially in recent years. The United Kingdom operates just 21 licensed greyhound tracks according to Blue Cross analysis, down from more than 77 at the industry’s peak according to the GREY2K World Stage Report. This consolidation means serious punters can study each remaining venue in genuine depth rather than spreading attention thinly across dozens of circuits. Sheffield’s extensive race programme, with fixtures on multiple days each week, generates the sample sizes needed for reliable trap statistics.
The numbers matter most when combined with other factors. A trap one draw does not guarantee victory. A trap six draw does not preclude it. But ignoring trap statistics entirely means throwing away one of the few genuinely predictive tools available in greyhound racing. The punter who understands that Sheffield favours inside runners starts every race with a small informational advantage over those who treat every trap as equal.
Distance-by-Distance Breakdown
Trap bias at Sheffield varies dramatically depending on race distance, and understanding these variations separates serious analysts from casual punters. The track hosts nine official distances ranging from 280 metres up to 934 metres, each presenting different tactical challenges that alter which starting positions hold the advantage.
Sprint races over 280 metres amplify trap bias to its most extreme. The race covers barely more than one turn, giving dogs almost no time to recover from poor first-bend positions. A trap one runner that shows even average early pace will reach the bend first and hold that rail position to the finish line. Trap six faces an uphill struggle from the moment the hatch opens, needing explosive speed just to stay in contact. Statistical analysis of 280-metre races at Sheffield shows inside traps winning significantly more often than at longer trips, sometimes by margins of five percentage points or more above theoretical average.
The standard 362-metre trip shows similar patterns with slightly less intensity. One additional bend gives outside runners marginally more opportunity to find racing room, but the sprint nature of the race still favours dogs that lead into the first turn. Middle traps like three and four perform relatively better here than at 280 metres, though trap one retains its advantage.
Sheffield’s most common distances, the 480-metre and 500-metre trips, present the bread-and-butter test of trap statistics. These races include enough running to allow form and fitness to influence results, yet the first-bend position remains crucial. Trap one maintains its edge, trap three offers reliable place prospects, and trap six continues to underperform. The 480-metre trip at Sheffield produced track record time of 27.27 seconds when Roxholme Magic blazed around in September 2020, demonstrating that inside runners can post exceptional times when everything aligns.
Middle-distance races over 660 metres and 720 metres begin shifting the balance. These extended trips include more turns and more opportunities for late-running dogs to find passing lanes. Trap bias remains present but softens noticeably. Dogs drawn wide with strong finishing speed can overcome early positional disadvantage, though they still face the fundamental problem of covering extra ground at every bend.
The marathon trips at 915 metres and 934 metres represent Sheffield’s stamina tests. At these distances, trap bias matters least because the extended duration allows class and conditioning to overcome starting position. A fit stayer from trap six can work through the field over nearly a kilometre of racing, whereas a fading sprinter from trap one might surrender an early lead by the third bend. The 934-metre track record belongs to Roxholme Magic with 56.28 seconds, proving that exceptional greyhounds transcend trap concerns at any distance.
Hurdle races over 500 metres with obstacles add another variable. The presence of hurdles disrupts normal racing patterns enough that trap bias becomes secondary to jumping ability. A clean jumper from any trap can dominate, while a hesitant hurdler from trap one might lose all positional advantage at the first obstacle.
The First Bend Factor
If trap statistics have a single underlying cause, it lies in what happens at the first bend. Sheffield’s run to first bend measures between 60.5 and 62 metres depending on trap position, and those figures matter more than almost any other specification on the track.
The physics are straightforward. Dogs break from their traps at roughly equal speed. They then accelerate toward the first turn while drifting toward their natural running line. Inside runners aim to hold the rail. Outside runners either challenge for the lead or settle behind. The critical moment arrives when six dogs converge on a space that comfortably holds perhaps three abreast.
Crowding at the first bend produces the patterns that trap statistics measure. When dogs bunch together, inside runners rarely lose ground because they can hug the rail and maintain position. Middle runners face traffic from both sides and must either assert themselves forward or accept a checked run. Outside runners must either show exceptional early pace to clear the field or swing wide and lose lengths. The mathematical consequences of these repeated scenarios create the win rate differentials that punters analyse.
Sheffield’s 60.5-metre run to the first bend sits roughly in the middle range for British tracks. Some circuits offer longer runs that reduce crowding and soften trap bias. Others provide shorter runs that intensify the scramble. Owlerton’s geometry creates enough distance for fast beginners to establish position but not enough for slow starters to recover, producing the moderate but consistent bias that characterises the venue.
Graders and trainers understand these dynamics intimately. Dogs with known early speed often receive outside draws because graders expect them to overcome the positional disadvantage. Slow starters get inside draws to compensate for their tendency to lose ground early. This balancing act explains why trap statistics never become perfectly predictive. The grading system consciously works against extreme outcomes, though it cannot eliminate underlying physical advantages.
Understanding the first-bend factor helps punters evaluate individual races beyond raw statistics. A trap one runner facing three confirmed fast beginners in traps two, three, and four faces different prospects than one drawn inside a field of slow starters. The statistics provide a baseline; the form analysis determines whether a specific race will follow or deviate from the pattern.
Running Styles and Trap Selection
Every greyhound develops a characteristic running style that determines where it naturally positions itself during a race. Railers hug the inside, wide runners swing to the outside, and middlers compete for the central ground. Matching running style to trap draw can transform an ordinary bet into a smart one.
Railers drawn in trap one represent the ideal scenario. These dogs want to run next to the rail, and starting from the inside gives them immediate access to their preferred position. A railer from trap one that shows reasonable early pace will almost certainly hold the rail through the first bend, eliminating the positional battles that cost other dogs ground. When Sheffield’s form guides show a known railer drawn in box one, the trap statistics argue strongly in favour of that dog.
The same railer drawn in trap six faces the opposite problem. To reach the rail, it must cross the paths of five other dogs, losing lengths with every stride. Some railers possess enough early speed to accomplish this crossing manoeuvre, but most cannot. A railer from trap six typically either gets crowded at the first bend while attempting to cut inside or settles for an unfamiliar wide running line that negates its natural advantage.
Wide runners reverse the equation. These dogs naturally drift to the outside and often perform poorly from inside traps where they must either suppress their instincts or cross traffic to reach their preferred line. A wide runner from trap five or six can swing to the outside with minimal interference, while the same dog from trap one or two might cause crowding as it drifts across the field.
Middle runners present the most complex analytical challenge. These dogs can adapt to various positions but excel when finding clear running room rather than dominating from a specific line. Middle runners often perform well from traps three and four, where they face equal pressure from both sides and can choose their racing position based on how the break develops.
The regulated nature of British greyhound racing ensures trainers and graders understand these dynamics. As Jeremy Cooper, Chair of GBGB, has noted: “Thanks to the strategic vision of Professor Madeleine Campbell and the relentless drive and determination of our Board along with the support of our entire sport, we have placed welfare at the very heart of licensed racing.” That focus on welfare extends to grading decisions that attempt to give each dog fair racing opportunities, though the physics of trap position still create measurable advantages regardless of how carefully races are constructed.
The practical application requires cross-referencing trap statistics with individual running styles. A general inside bias at Sheffield might suggest backing trap one, but if that dog is a confirmed wide runner while a known railer sits in trap three, the running style information might override the raw positional advantage. The best bets emerge when trap draw and running style align rather than conflict.
Using Trap Stats in Your Analysis
Trap statistics work best as one component of a broader analytical approach rather than as a standalone selection method. The punter who backs every trap one at Sheffield will lose money over time, but the punter who ignores trap statistics entirely will also underperform. The skill lies in knowing when positional advantage outweighs form and when form overrides position.
Start with the basic probability assessment. In a six-runner race with evenly matched dogs, trap one at Sheffield might warrant slightly better than even money based purely on historical win rates. Compare this theoretical price to the actual market odds. If the bookmaker offers 5/2 about a trap one runner that genuine analysis suggests deserves 7/4, the trap statistics are already priced into the market. No edge exists. But if a trap one runner shows at 7/2 when the numbers suggest 5/2, the trap factor might be creating value that the market has missed.
Weight trap statistics more heavily in races with evenly matched runners. When form figures show little separation between the six contestants, positional advantage becomes the tiebreaker. The sprint races and lower-grade contests that dominate Sheffield’s schedule often feature fields where no dog stands out on ability, making trap draw the single most predictive factor.
Reduce the weight given to trap statistics when one dog clearly outclasses the field. Superior greyhounds overcome positional disadvantage because they possess the raw speed and strength to power through traffic. A trap six runner with significantly better form than its opponents might be worth backing despite the statistical headwind, especially at longer distances where class tells over time.
Consider trap statistics essential in forecast and tricast betting. When predicting exact finishing orders, the trap-influenced probabilities of each dog finishing first, second, or third affect the entire combination. A trap one/trap three combination might represent fair value even if neither dog looks the obvious winner, simply because both traps produce reliable place percentages at Sheffield.
Track your results separately by trap. Personal record-keeping reveals whether your interpretations of Sheffield’s trap bias produce profitable outcomes over time. The statistics published by data services represent historical averages; your actual betting performance depends on how accurately you apply those averages to individual race conditions.
Limitations of Trap Statistics
Trap statistics describe historical patterns, not guaranteed futures. Every percentage quoted represents a probability derived from past races, and past performance does not guarantee future results. The punter who treats trap bias as certainty will eventually face costly surprises when form, fitness, or random chance overrides positional advantage.
Sample size matters enormously. Statistics calculated from a thousand races carry more weight than those from a hundred. Seasonal variations, track maintenance changes, and shifts in the competing greyhound population all influence results. A trap bias measured over five years might not persist identically into the next twelve months, though major changes typically require unusual circumstances.
The quality of opposition in each race affects how trap advantages play out. In top-grade races featuring battle-hardened greyhounds, running styles become more varied and competition more intense. The clean running that allows trap one to dominate lower grades gives way to contested first bends where any dog might emerge ahead. Using statistics derived from all races regardless of grade can mislead when applied to specific high-quality contests.
Individual race conditions introduce variables that statistics cannot capture. Weather affects track surface. Time of day affects greyhound behaviour. The specific combination of six dogs in any given race creates unique dynamics that deviate from historical norms. A punter analysing a Tuesday evening sprint might find the statistics suggest one outcome while everything about that particular race points toward another.
The market itself adjusts for trap bias. Bookmakers know the numbers as well as punters do, and their prices reflect anticipated outcomes. Finding value requires identifying situations where the market has mispriced the trap factor, either by overweighting position in a form-dominated race or underweighting it when evenly matched fields make the draw crucial. The existence of trap statistics does not guarantee profitable betting; exploiting them successfully requires additional analytical skill.
Sheffield Owlerton hosts 260 race meetings annually, producing thousands of data points each year. The numbers matter precisely because they accumulate across this vast sample, revealing genuine patterns rather than random noise. But numbers that matter are not numbers that guarantee, and the difference defines the line between informed betting and wishful thinking.